

We have switched maps again ..the last map though we liked the look of it ..created a lot of difficulty when it came to filling in the zones.
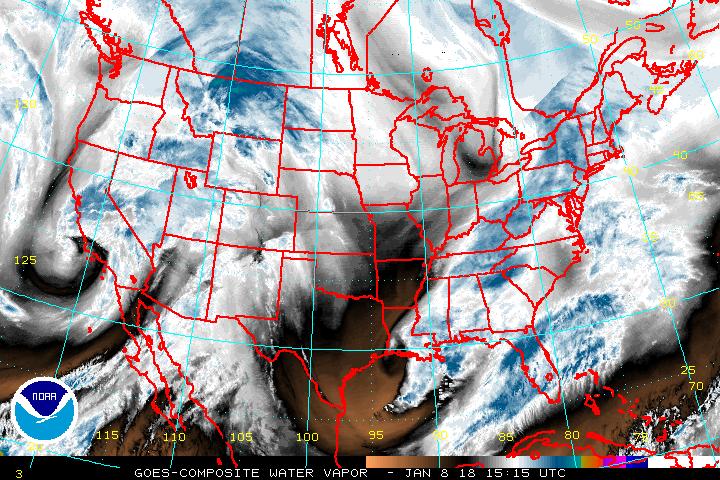
Taking a look at the water vapor image this evening..
http://www.ssd.noaa.gov/goes/comp/ceus/wv-l.jpg
You can see besides the SW TX region the air once again in TX is on the dry side... the moisture should increase a little bit this evening with any severe staying to the west of Wichita Falls TX area and perhaps some shower activity around the falls area. There after once again it looks as if dry air will be moving back into the region and this is the reason that we have not really included a southern extent despite the dry line being in place.
So lets look at the latest surface map to get a perspective on what is happening and should happen then for tomorrow..
http://www.hpc.ncep.noaa.gov/sfc/90fwbg.gif
You can see the stationary front and this stationary front has been what is causing severe weather along it ..along with the day time heating and parameters that are in place..
This stationary front is suppose to lift thru as a warm front into Southern New England and this warm front will bring a chance of severe winds and hail into the NE States..
The trigger needed for this severe weather chance will be a cold front that is on the move Southeast from the Great Lakes region. This front will clash into warm air that should be in place and with the parameters in place create the "spark needed" for the severe!
It will also be this same cold front that will bring the chance for severe weather into the rest of the zone..
So lets now look at the severe Parameters that will be in place in order to determine what type of severe weather we will be dealing with outside of the NE states!
TEMPERATURES in the 70s to the 100's (talk about HOT)
http://www.twisterdata.com/data/models/nam/221/maps/2012/05/03/18/NAM_221_2012050318_F24_TMPF_2_M_ABOVE_GROUND.png
DEW POINTS in the 60s to 70s
http://www.twisterdata.com/data/models/nam/221/maps/2012/05/03/18/NAM_221_2012050318_F24_DPTF_2_M_ABOVE_GROUND.png
CAPE 500-4500 depending on where you are located...
http://www.twisterdata.com/data/models/nam/221/maps/2012/05/03/18/NAM_221_2012050318_F24_CAPE_SURFACE.png
LIFT INDEX to as low as negative 12
http://www.twisterdata.com/data/models/nam/221/maps/2012/05/03/18/NAM_221_2012050318_F24_PLI_30_0_MB_ABOVE_GROUND.png
EHI is pretty significant in the OK region
http://www.twisterdata.com/data/models/nam/221/maps/2012/05/03/18/NAM_221_2012050318_F24_EHI_1000_M.png
However..the HELICITY ..is not the greatest allocated with the EHI ..In other words the HELICITY is on the lower side..
http://www.twisterdata.com/data/models/nam/221/maps/2012/05/03/18/NAM_221_2012050318_F24_HLCY_1000_M_ABOVE_GROUND_0_M_ABOVE_GROUND.png
In addition to this the air at 700 mb Relative Humidity level is rather dry..
http://www.twisterdata.com/data/models/nam/221/maps/2012/05/03/18/NAM_221_2012050318_F24_RH_700_MB.png
And in addition to that the shear is also lacking in that particular region. (elsewhere about 35+ knots)
http://www.twisterdata.com/data/models/nam/221/maps/2012/05/03/18/NAM_221_2012050318_F24_SHRM_500_MB.png
Now if the CAP can be broken and we will have to keep an eye on the later models runs places like OK could end up seeing the potential for tornadoes! However..at the present time we think that the greatest threats in any of the zone will be straight line winds and hail.
Potential depending on future model runs for more of OK to be added into the coverage zone but will for now hold off on it!
Stay tuned
No comments:
Post a Comment