

July 20th Severe Weather Outlook
Two frontal features are going to be in play today that will be causing severe weather potential along with garden variety type storms and some heavy rain.
http://www.hpc.ncep.noaa.gov/basicwx/93fwbgus.gif
By 18 Z the first front will be just south of the PA/MD border and dragging a cold front thru KY...
The second front is back over the Midwest and extending back into the PNW. The front in the east will be dropping south while the front in the Midwest presses east south east. The weather in the east today will be cooler then as of late with temperatures only in the 70s and some rain showers about and perhaps a period of steadier rain.
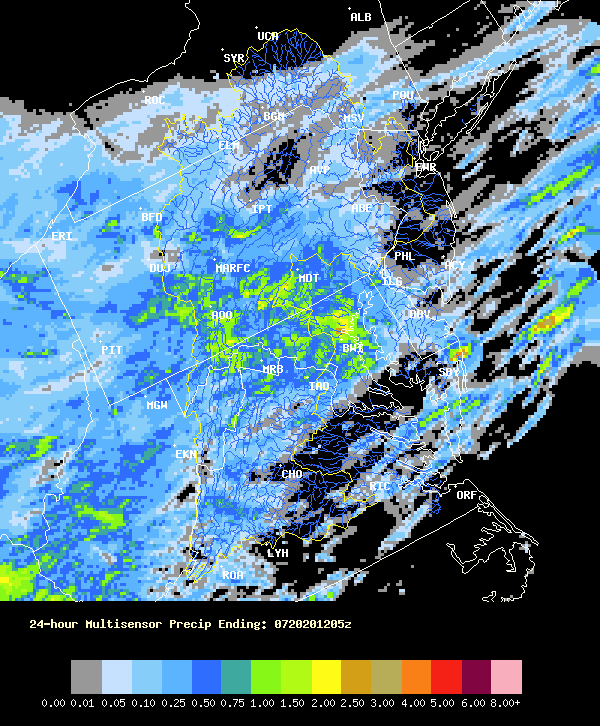
The rainfall that has fallen over the last twenty four hours has greatly under performed considering HPC was expecting a widespread 2 + inches across the state of PA from west to east.. This is what has fallen..
http://i973.photobucket.com/albums/ae219/theweathergod2010/past24.png
And this is what they are anticipating over the next 48 hr. period and it is considerably dropped.
http://www.hpc.ncep.noaa.gov/qpf/d12_fill.gif
Now lets look at the temperatures that will be in play thru out the severe zones..
http://www.twisterdata.com/data/models/nam/221/maps/2012/07/20/00/NAM_221_2012072000_F18_TMPF_2_M_ABOVE_GROUND.png
Dew Points will be highest in the southeast with them in the 60-70 degree range..
http://www.twisterdata.com/data/models/nam/221/maps/2012/07/20/00/NAM_221_2012072000_F24_DPTF_2_M_ABOVE_GROUND.png
CAPE or Convective Available Potential Energy is between 500-4000 depending on where you are located..
http://www.twisterdata.com/data/models/nam/221/maps/2012/07/20/00/NAM_221_2012072000_F24_CAPE_SURFACE.png
Lift Index if from 0 to about negative 8 depending on where you are located..
http://www.twisterdata.com/data/models/nam/221/maps/2012/07/20/00/NAM_221_2012072000_F24_PLI_30_0_MB_ABOVE_GROUND.png
Greatest Shear will actually be across the region in the Midwest with 30-60 knots from the surface to 500 mb
http://www.twisterdata.com/data/models/nam/221/maps/2012/07/20/00/NAM_221_2012072000_F24_SHRM_500_MB.png
EHI or Energy Helicity Index is indicative of super cell potential from Eastern Washington into Western Montana and then indicative of super cell potential with 2% tornado potential across Minnesota.. also from TN back thru Alabama and Mississippi and perhaps into Louisiana .
http://www.twisterdata.com/data/models/nam/221/maps/2012/07/20/00/NAM_221_2012072000_F24_EHI_3000_M.png
Helicity is also 300 or above in these same general locations..
http://www.twisterdata.com/data/models/nam/221/maps/2012/07/20/00/NAM_221_2012072000_F24_HLCY_3000_M_ABOVE_GROUND_0_M_ABOVE_GROUND.png
Once again if you are in any of the highlighted locations above please keep an eye and an ear tuned to your favorite weather source! As always enjoy the weather and be safe!
No comments:
Post a Comment